
![]()
Piktochart is an online platform that allows users to create visually appealing infographics, presentations, posters, and reports without needing advanced design skills. With the rise of visual content in communication, Piktochart offers an accessible way for individuals and businesses to create high-quality visual content that is engaging, informative, and visually appealing. By providing a library of customizable templates, graphics, icons, and other design elements, Piktochart enables users to create professional-looking visual content quickly and easily.
Visual content has become increasingly important in recent years, as it has been shown to be more effective in communicating complex information than text alone. In today’s world, where people are inundated with vast amounts of information, creating visual content that stands out is crucial to ensuring that your message is heard. Piktochart’s platform has made it easier for people with little or no design experience to create high-quality visual content that grabs people’s attention and conveys information effectively.
One of the key advantages of Piktochart is its accessibility. The platform is designed for non-designers, and its user interface is intuitive and easy to use. This means that users can create visual content quickly and easily, without the need for extensive training or experience. Furthermore, Piktochart offers a range of plans, including a free version, which makes it accessible to users with different budgets and needs. Whether you’re a small business owner, an educator, a non-profit organization, or an individual looking to create engaging visual content, Piktochart offers a platform that is both accessible and effective.
User Interface and Ease of Use
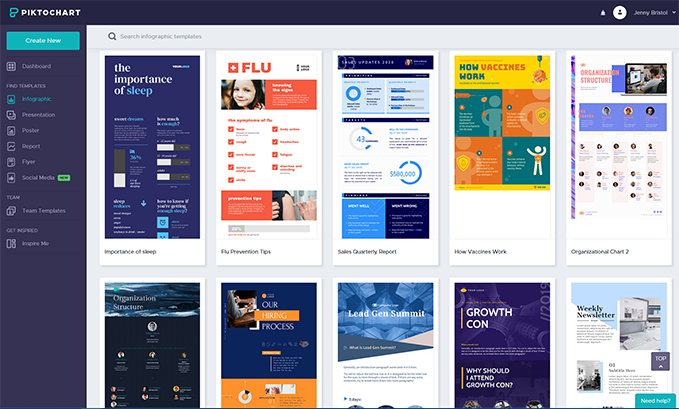
Piktochart’s user interface is designed to be user-friendly and easy to navigate, even for those who have little or no design experience. The platform’s dashboard is well-organized, with clear options for creating new projects, accessing previous projects, and browsing the template library.
Intuitive Design
One of the strengths of Piktochart’s interface is its intuitive design. Users can access a library of pre-made templates, which can be easily customized to suit their needs. Piktochart offers a wide variety of templates, including those for infographics, presentations, posters, and reports. These templates are well-designed and visually appealing, making it easy for users to create professional-looking visual content quickly.
Drag-and-Drop Interface
Piktochart’s drag-and-drop interface allows users to add and arrange elements quickly and easily. Users can add text, images, graphics, and icons to their projects by simply dragging and dropping them onto the canvas. The platform also offers a range of tools to customize text, images, colors, and fonts, allowing users to create unique visual content that stands out.
User-Friendly Tools and Features
Another advantage of Piktochart’s user interface is its ease of use for non-designers. The platform’s tools and features are designed to be accessible and user-friendly, with clear instructions and tips provided throughout the creation process. Even if you have no design experience, you can create a visually appealing infographic or presentation using Piktochart’s platform.
Library of Graphics and Icons
Piktochart offers a library of graphics, icons, and other design elements, which can be added to your project with a simple drag-and-drop. These design elements are high-quality and visually appealing, making it easy for users to create engaging and informative visual content. The platform also allows users to upload their own images and fonts, giving them even greater flexibility in customizing their projects.
Accessibility
One of the key advantages of Piktochart is its accessibility. The platform is designed for non-designers, and its user interface is intuitive and easy to use. This means that users can create visual content quickly and easily, without the need for extensive training or experience. Furthermore, Piktochart offers a range of plans, including a free version, which makes it accessible to users with different budgets and needs.
Features and Functionality
Piktochart offers a range of features and functionality to help users create high-quality visual content quickly and easily. Some of the key features of the platform include:
Pre-Made Templates
Piktochart offers a library of pre-made templates for users to choose from. These templates are designed to be visually appealing and can be easily customized to suit the needs of the user. Templates are available for a range of projects, including infographics, presentations, posters, and reports.
Customization Options
Piktochart allows users to customize their projects using a range of tools and features. Users can add text, images, graphics, and icons to their projects and customize these elements using a range of formatting options. The platform also offers a range of design elements, including charts, maps, and illustrations, which can be used to enhance the visual appeal of the project.
Collaboration Tools
Piktochart offers a range of collaboration tools, which makes it easy for users to work together on projects. Users can share their projects with others and collaborate in real-time, making it easy to share feedback and make changes as needed. The platform also allows users to leave comments and notes on projects, making it easy to keep track of feedback and changes.
Integration Options
Piktochart integrates with a range of other tools and platforms, making it easy to incorporate visual content into other projects. The platform offers integrations with tools such as Google Drive, Dropbox, and Slideshare, making it easy to share and collaborate on projects across different platforms.
Export Options
Piktochart allows users to export their projects in a range of formats, including PNG, PDF, and HTML. This makes it easy to share projects with others or incorporate them into other projects or platforms.
Analytics
Piktochart offers analytics and tracking tools, which allows users to track the performance of their projects. Users can track metrics such as views, shares, and engagement, making it easy to measure the impact of their visual content.
Collaboration and Sharing
Collaboration and sharing are important features for any visual content creation platform, and Piktochart offers a range of tools and functionality to make collaboration and sharing easy and effective. Here are some of the key aspects of Piktochart’s collaboration and sharing features:
Sharing and Publishing Options
Piktochart offers a range of options for sharing and publishing visual content. Users can share their projects directly from the platform via email, social media, or a unique URL. They can also publish their projects on their own website or blog using an embed code, or share them on other platforms such as Slideshare or LinkedIn.
Collaboration Tools
Piktochart’s collaboration tools make it easy for teams to work together on visual content projects. Users can invite team members to collaborate on a project, and work together in real-time on the same project. Users can leave comments and feedback on a project, making it easy to track changes and updates.

Team Management
Piktochart offers team management tools that make it easy to manage and collaborate with multiple users. Team owners can invite team members, set user permissions, and manage team access to projects. This is particularly useful for teams working on multiple projects, as it allows for efficient collaboration and management of resources.
Security and Privacy
Piktochart takes security and privacy seriously, and offers a range of features to protect user data. The platform uses SSL encryption to secure all user data, and offers two-factor authentication for added security. Users can also control the privacy settings of their projects, choosing to make them public or private.
Analytics and Tracking
Piktochart’s analytics and tracking tools make it easy to track the performance of visual content projects. Users can track metrics such as views, shares, and engagement, making it easy to measure the impact of their visual content. This information can be used to make data-driven decisions about future content creation and sharing.
Pros and Cons
As with any software platform, there are both advantages and disadvantages to using Piktochart. Here are some of the key pros and cons to consider:
Pros
- User-Friendly Interface: Piktochart is known for its user-friendly interface that makes it easy for anyone to create professional-looking graphics.
- Customizable Templates: Piktochart offers a wide range of customizable templates that can be used as a starting point for your visual content projects.
- Cost-Effective: Piktochart’s pricing plans are affordable and provide great value for money, particularly for individuals and small businesses.
- Collaborative Tools: Piktochart’s collaborative tools make it easy for teams to work together on visual content projects, improving workflow and productivity.
- Versatile: Piktochart can be used for a wide range of purposes, including creating infographics, reports, presentations, and social media graphics.
Cons
- Limited Customization: While Piktochart’s templates are customizable, there are limitations to the level of customization that can be achieved.
- Limited Image Editing: Piktochart does not offer advanced image editing tools, which may be a drawback for some users.
- Limited Animation: While Piktochart does offer some animation options, it may not be suitable for users looking to create highly animated content.
- Limited Font Options: Piktochart’s font library is limited, which may be a drawback for users looking for a wider range of font choices.
- No Offline Editing: Piktochart is an online platform, which means that it requires an internet connection to use, and does not offer offline editing options.
Overall, while there are some limitations to Piktochart, the platform’s user-friendly interface, customizable templates, cost-effectiveness, collaborative tools, and versatility make it a popular choice for creating visual content.
Customer support and resources
Customer support and resources are important considerations when evaluating any software platform, and Piktochart offers a range of resources to help users get the most out of the platform. Here are some of the key aspects of Piktochart’s customer support and resources:
Help Center
Piktochart’s help center is a comprehensive resource that provides users with answers to common questions and issues. It includes articles, tutorials, and video guides that cover everything from getting started with Piktochart to using specific features and tools.
Email Support
Piktochart offers email support to users who need assistance with the platform. Users can submit a support ticket via email and expect a response within 24 hours.
Community Forum
Piktochart’s community forum is a platform for users to connect with one another and ask for advice, share tips and tricks, and provide feedback on the platform. It’s a great resource for users who want to learn from others’ experiences and get help from the Piktochart community.
Enterprise Support
For users with more advanced needs, Piktochart offers enterprise support options. These options include dedicated support representatives, onboarding and training services, and priority support.
Blog and Social Media
Piktochart’s blog and social media channels are great resources for users who want to stay up-to-date on the latest news, updates, and best practices for using the platform. The blog includes articles and tutorials on a range of topics, while the social media channels provide users with the opportunity to engage with the Piktochart community and get inspiration from other users’ work.
Piktochart pricing
They offer different pricing plans that cater to the specific needs of each user. In this article, we’ll discuss each pricing plan and its features to help you choose the right plan for you.
Individual & Business Plans
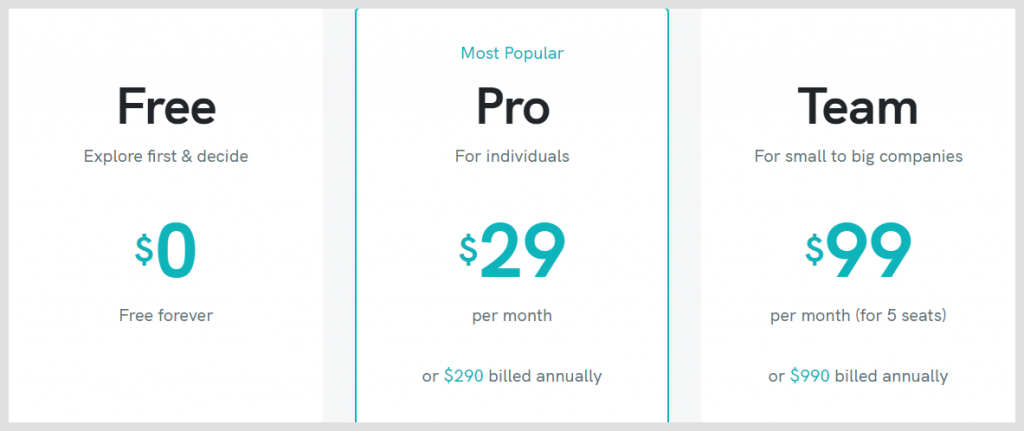
Free Plan
The Free Plan is ideal for starters looking to improve their visual communication. It is free forever and includes the following features:
- Access to over 1,000 templates
- Limited number of images and icons
- Limited storage space
- Standard resolution download
- Piktochart watermark on all exports
Pro Plan
The Pro Plan is for professionals and small teams looking to manage their brand and visuals in a scalable way. It costs €14.00 per member, per month when paid monthly, or you can save 52% by paying annually. The Pro Plan includes all the features of the Free Plan plus:
- Access to all templates
- Unlimited number of images and icons
- Increased storage space
- High-resolution download
- No Piktochart watermark on all exports
- Custom fonts and branding
- Collaboration features
Enterprise Plan
The Enterprise Plan is for organizations with over 25 members. It is a custom plan that includes all the features of the Pro Plan plus:
- Dedicated account manager
- Custom user roles and permissions
- Advanced security features
- API integration
- Onboarding and training
Education Plans
Pro Plan
The Pro Plan for Education is for students and educators looking to manage their visuals in a scalable way. It costs €39.99 per member, per year and includes all the features of the Pro Plan.
Nonprofit Plans
Pro Plan
The Pro Plan for Nonprofits is for individuals and small organizations looking to manage their brand and visuals in a scalable way. It costs €60.00 per member, per year and includes all the features of the Pro Plan.
Payment Options
Piktochart accepts Visa, MasterCard, or Paypal as payment methods. If you want to use American Express, you can select the option to pay via PayPal with the Amex card. For purchases of $168 or more for which you’d like to make a direct bank deposit, you can contact them at support@piktochart.com, and they’ll respond with further instructions. Please note that a funds transfer such as this does take several days to complete.
Refund Policy
Piktochart provides refunds for any payments within the last 30 days of the initial transaction for subscriptions purchased at the standard rate, or at the discounted rate applied to EDU and NPO accounts. Classroom subscriptions purchased at a bulk rate are not eligible for refunds. For more information, you can refer to their Terms of Use.
Upgrade or Downgrade
You can cancel your subscription at any time from your Account Settings. You can also request an upgrade or downgrade to your plan by reaching out to support@piktochart.com.
Conclusion
Piktochart is a powerful and versatile platform for creating visual content. Its user-friendly interface, customizable templates, cost-effectiveness, collaborative tools, and versatile features make it a popular choice for individuals and small businesses. While there are some limitations to Piktochart’s customization options, image editing, animation, and font library, it remains a valuable tool for creating engaging and professional-looking graphics.
In addition, Piktochart’s customer support and resources are comprehensive and well-rounded. The help center, email support, community forum, enterprise support options, blog, and social media channels provide users with a range of options for getting help, learning from others, and staying up-to-date on the latest news and best practices.
Overall, Piktochart is a highly recommended platform for anyone looking to create visual content quickly and easily. Its combination of user-friendly design, affordability, and powerful features make it a valuable asset for individuals, small businesses, and even larger enterprises. Whether you’re creating infographics, reports, presentations, or social media graphics, Piktochart is an excellent choice for getting the job done.
Frequently asked questions
Is Piktochart or Canva better?
Both Piktochart and Canva are excellent graphic design platforms with their unique features and benefits. Ultimately, which one is better depends on your specific needs and preferences. Here are some factors to consider when deciding which platform is best for you:
Ease of Use: Both platforms have a user-friendly interface that allows users to create designs easily, even if they have no prior design experience. However, some users may find Canva’s drag-and-drop interface easier to use than Piktochart’s.
Templates and Design Elements: Both Piktochart and Canva offer a vast library of templates, graphics, icons, and other design elements that users can use to create their designs. While both platforms have a wide variety of options, Canva has a more extensive library of design elements than Piktochart.
Customization Options: Both platforms offer several customization options that allow users to personalize their designs. However, Piktochart has more advanced customization options than Canva, such as the ability to create and customize charts and graphs.
Collaboration Features: Both platforms allow users to collaborate with others on designs. However, Piktochart offers more collaboration features, such as the ability to comment and give feedback directly on designs.
Pricing: Both Piktochart and Canva offer free and paid plans. However, Piktochart’s paid plans are more affordable than Canva’s, making it a better option for users on a tight budget.
Is Piktochart easy-to-use?
Yes, Piktochart is designed to be an easy-to-use platform that allows users to create professional-looking infographics, presentations, posters, and other visual content even if they have no prior design experience.
Piktochart’s user interface is intuitive and user-friendly, featuring a drag-and-drop editor that allows users to add and customize text, images, charts, icons, and other design elements quickly and easily. The platform also provides users with access to a vast library of templates and design assets that they can use as a starting point for their designs.
Furthermore, Piktochart offers various tutorials, resources, and support options to help users get started and improve their design skills. These resources include an extensive help center with FAQs, video tutorials, webinars, and a community forum where users can share tips and tricks with each other.
Can anyone create infographics using Piktochart?
Yes, anyone can create infographics using Piktochart. Piktochart is designed to be a user-friendly platform that allows users with no prior design experience to create professional-looking infographics and other visual content quickly and easily.
Piktochart provides users with access to a vast library of templates, graphics, icons, charts, and other design elements that they can use to create their infographics. The platform also features a drag-and-drop editor that allows users to add and customize these elements, as well as text, images, and other content, with ease.
Additionally, Piktochart offers various tutorials, resources, and support options to help users get started and improve their design skills. These resources include an extensive help center with FAQs, video tutorials, webinars, and a community forum where users can share tips and tricks with each other.
Whether you’re a student, a business owner, a marketer, a blogger, or anyone else who needs to create infographics, Piktochart is an excellent option for anyone looking for an easy-to-use and affordable graphic design platform.
Can you save Piktochart as PDF?
Yes, you can save your Piktochart designs as PDF files. Piktochart provides several options for exporting your designs, including the ability to export them as PDF files.
To save your Piktochart design as a PDF, follow these steps:
- Open your Piktochart design and click on the “Download” button in the top menu bar.
- In the dropdown menu, select “PDF Document” as the export format.
- Choose the desired export options, such as the page orientation, size, and quality.
- Click the “Download” button to save your design as a PDF file.
Once your Piktochart design has been exported as a PDF file, you can open it with any PDF reader or editor and share it with others as needed. Exporting your designs as PDF files is an excellent way to ensure that they can be viewed and printed correctly across different devices and platforms.
Can two people edit on Piktochart?
Yes, two or more people can collaborate and edit a Piktochart design by using the team feature. The team feature allows multiple users to work on the same design simultaneously and make changes in real-time.
To collaborate on a Piktochart design, follow these steps:
- Create or open a Piktochart design and click on the “Share” button in the top menu bar.
- In the dropdown menu, select “Invite Collaborators.”
- Enter the email addresses of the people you want to invite to collaborate on your design.
- Choose the desired level of access for each collaborator, such as view-only, edit, or admin.
- Click the “Send Invites” button to send the invitations to your collaborators.
Once your collaborators have accepted the invitation, they can access the shared design and make changes to it in real-time. Piktochart’s team feature also includes version history, which allows you to revert to earlier versions of the design if needed, and a commenting system, which allows you to communicate with your collaborators and provide feedback.
Collaborating on Piktochart is an excellent way to work together with others on a design project and streamline the creative process.